The following is an excerpt from the book Smart and SeXy by Roderick Kaine. For additional excerpts and reviews please see this page. Please see “women and the university” for a related discussion on female educational choices. “Vanity Marketing: for women only” is a good discussion on female susceptibility to marketing campaigns.
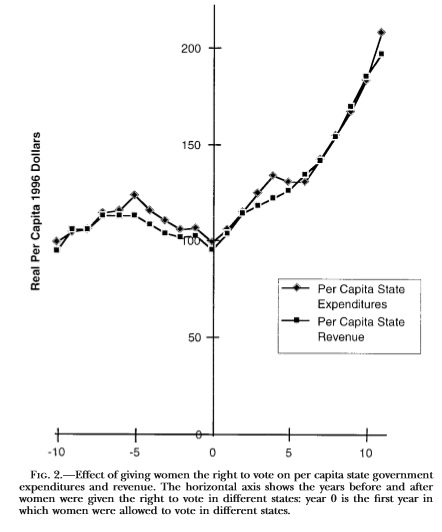
The feminine imperative results in massive increases in the size and scope of government; especially in increasing taxation to facilitate wealth transfers to the poor and increasing wealth transfers from men to women post-divorce. Women’s suffrage has been shown to have caused between a 25 and 33% increase in government expenditure within 11 years of its implementation for various governments at various times [see this and this]. According to IRS data, men in the US pay substantially more (almost double) in taxes than women; mainly because of their higher income. Comparing self-employed men to self-employed women, which conveniently factors out any potential make-work jobs for both groups, shows an even greater divergence with men paying more than three times the amount of taxes than women.i

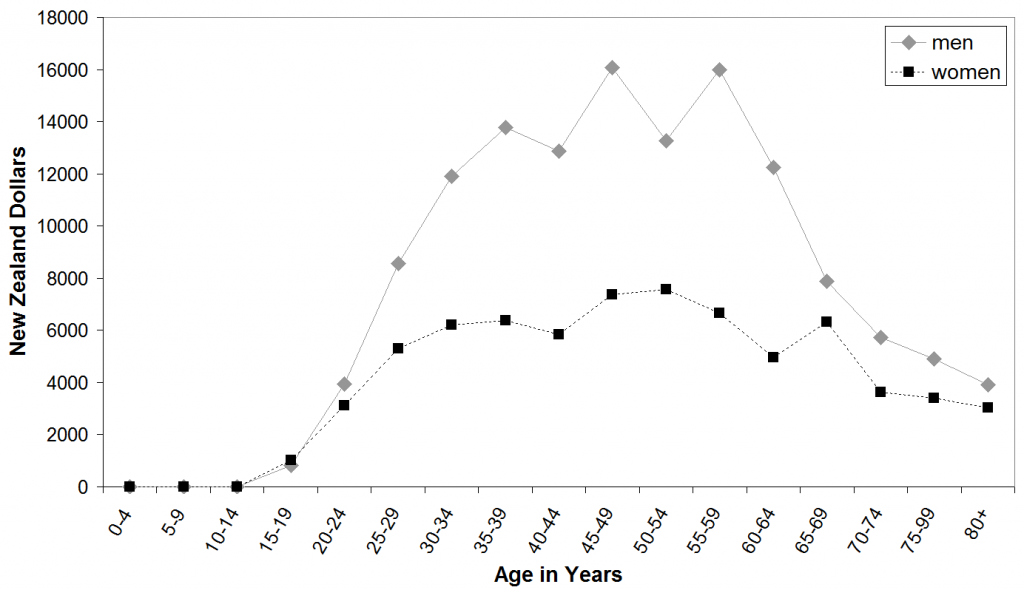
Men earn more partially because of their greater devotion to the workforce in terms of hours worked per week and more uninterrupted, consecutive years of participation in the workforce. Superhaplotypes of the X chromosome [discussed in greater detail in the book] also cause there to be a greater number of very high IQ men than very high IQ women which causes men to be over-represented in the highest paid positions that require high intelligence. Such professions tend to pay more due to their greater difficulty and the limited number of people able to perform them.Other western countries have similar patterns. One of the best studies on differences in government payments and benefits receipt by gender was done on the population in New Zealand. Taxes paid vary significantly across all age ranges, but during the majority of their lifetime men are contributing about twice as much in Tax revenue (14,000 vs. 6,000 NZD annually during working age) and are always contributing more than women during the entirety of working age.ii
On the other side of the coin, women receive substantially more income support benefits compared to men both in terms of monetary value per woman and in the number of women receiving benefits. How much more women receive than men varies with age, but it is higher at all ages and peaks at 4.8 times what men receive during the 35-39 age range. This is likely due to the increased support given to single mothers with dependents.
Direct Tax Per Capita by Age and Gender
Received Income Support Per Capita by Age and Gender
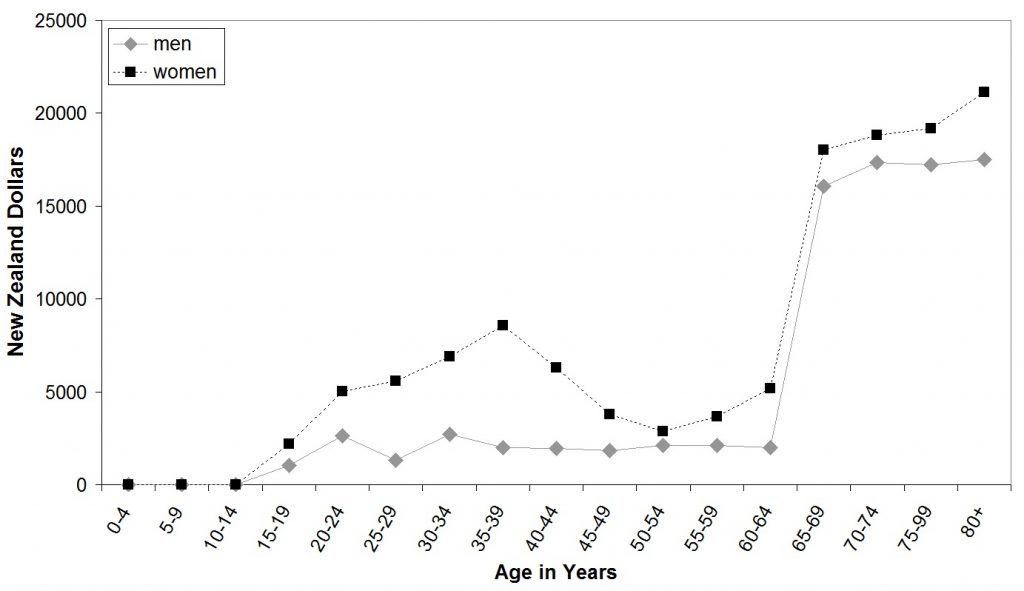
The above graph shows incomes support benefits per capita by age and gender. Income support is analogous to welfare and retirement benefits in the US. Throughout all points of life after working age, women collect more benefits than men; the exact opposite pattern of payments to the state. During child rearing years, there is a large peak in benefits collected by women compared to men which reduces somewhat as children become adults and are no longer dependent on mothers. Data from: Aziz, O., Gemmell, N., Laws, A. (2013) The Distribution of Income and Fiscal Incidence by Age and Gender: Some Evidence from New Zealand. University of Victoria Working Paper.
Middle of life benefits in the US follow a similar pattern for similar reasons. The Temporary Assistance to Needy Families (TANF) mostly provides money for single mothers or the children of single mothers. 86% of adult recipients of the program are women.iii In addition, almost 1 in 4 women (23%) in the US receive food stamp assistance at some point in their lives; about twice the rate of men. There are some racial differences in receipt of benefits, but the gender pattern is consistent for all races. Among whites, 19% of women receive food stamps at some point in their lives vs. 11% of men. For blacks, the rates are 39% vs. 21% for women and men respectively.iv White women are thus nearly as dependent on government food stamp benefits as black males. Other welfare programs in the US which in practice are substantially or mainly wealth transfers to single mothers from taxpaying men include the Earned Income Tax Credit (EITC), the Women, Infants and Children food program (WIC), Supplemental Security Income (SSI), Child nutrition programs, public housing, section 8 housing and Medicaid.v, vi

In a fundamental sense these programs are equivalent to the cuckolding of all tax-paying men. Cuckolding is when a woman has a child by one man, but convinces a second that it is his in order to deceptively gain access to his accumulated resources. Men with self-respect and dignity do not pay for the children of other men. Welfare programs are similar except deception is not required because the state acts as the coercive middle man who makes the cuckolding mandatory. It is also less obvious than the personal case because the costs are dispersed among all productive men and they generally never interact with the single mothers directly to see their money being wasted. This wealth, which would be better spent by productive men providing for their own biological children, is forcibly taken from them to pay for women who have made extremely poor personal decisions in their lives and produced children statistically much more likely to be involved in criminal and disorderly behavior. The increased criminality of children of single mothers is a large externality which costs a society a great deal in terms of increasing police and prison spending on top of the direct wealth transfer programs.The recent introduction of the “affordable” health care act also acts as a wealth transfer from working-age men to women. Men go to the doctor and need medical care much less frequently than women. Before the new health care law, insurers were able to adjust prices based on gender to reflect actual costs. No more. Now men and women cannot be charged differently based on actual medical care use and single men are even required to pay for personal coverage which can only benefit women, such as maternity coverage. The result is that healthcare costs for young men have increased substantially more than for women of all ages. The average increase was 56% for men compared to 4% for women though in specific areas the average increase for young men has been as high as 200%.vii Car insurance shows the opposite pattern where men are made to pay more due to their greater likelihood of getting into catastrophic crashes (women are more likely to have an accident, but those are usually minor). Unsurprisingly, there has been no attempt to enforce “equality” in this situation.
The greatest income support occurs at the oldest ages, and is present in pretty much every western country. In New Zealand, older women receive about 20% more retirement benefits than men. Though the gap between benefits receipt isn’t as large per capita in retirement compared to other ages, men have a much shorter life expectancy than women which results in women in aggregate receiving substantially more benefits than is indicated by a per capita analysis. Women live 6-10 years longer than men on averageviii and in New Zealand, only 39% of people over 80 are male.ii
In the US, social security, Medicare, and the “affordable” healthcare act have much the same effect as retirement transfers do in New Zealand. The elderly, who are mostly women, are probably the single greatest beneficiary of the new US healthcare law. The demographic gap in the US favoring women among the old increases from 1.3 women per 1 man at age 65 until there are about 2 females for every 1 male at 85 years old and older.ix Considering the size of the wealth transfer in old age, socialized retirement benefits constitute an absolutely massive redistribution of wealth from working-age men, who pay much more into the system, to old women who as a group withdraw substantially more. In addition, it is likely that these older women did not contribute much during their youth considering what is known about female work habits. Medical care especially imposes massive costs. Such costs increase exponentially for the very old, most of which are female. Again, this is money that would be better used by young, productive men financing their own families instead of transfers towards entitlements for old women.
Net Fiscal Impact by Age and Gender
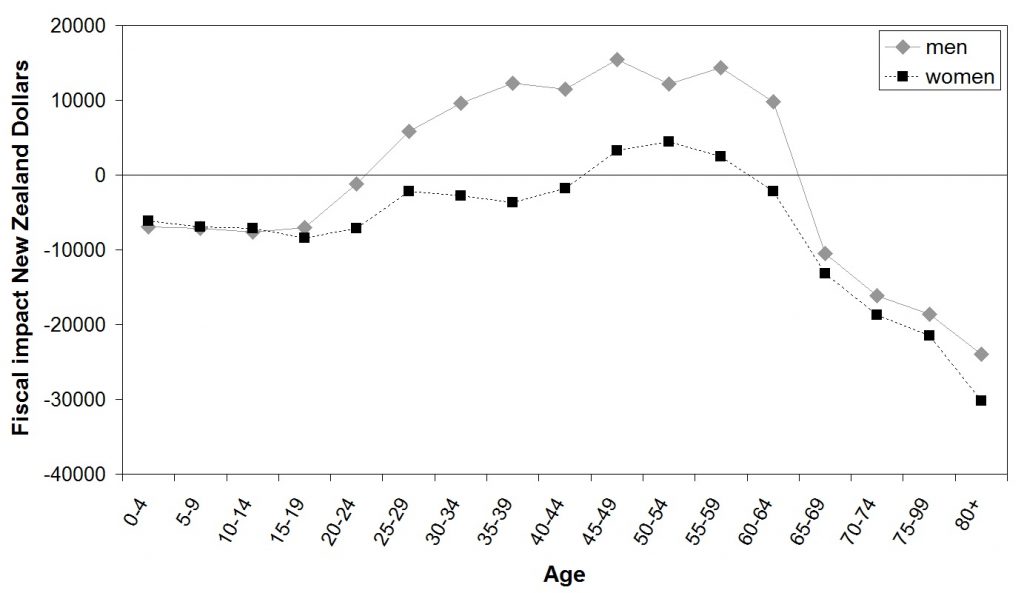
The above graph shows the per capita net fiscal impact by age and gender in 2010 in New Zealand. The net fiscal impact is calculated by subtracting government expenditures (education, income support, healthcare, etc) from direct and indirect taxation. Only figures which are easily attributable to individuals are used. From these figures, it can be seen that women withdraw more benefits from government than they put back in for most of their lifetimes. In other words, they have a negative net contribution to government finances for the majority of their lives. Women do not pass the break-even point and start contributing positively until their early to mid-40s. Data from: Aziz, O., Gemmell, N., Laws, A. (2013) The Distribution of Income and Fiscal Incidence by Age and Gender: Some Evidence from New Zealand. University of Victoria Working Paper.
The net fiscal impact is a measure that subtracts the costs of state benefits from paid taxes to find the net impact on government revenue. Comparing genders shows that, in New Zealand, women have a negative net fiscal impact over most of their lives (see graph on the previous page). As a group they take more money from the government than they pay into it. This difference must therefore be made up through increased taxes received from men. Men pass the break even point and start contributing positively in their early to mid twenties. However,
Women, on average, do not pass this ‘break even’ point until their mid-40s. This is due to a combination of lower workforce participation, higher health and education spending, higher income support and lower direct and indirect taxation.ii
The cumulative net fiscal impact adds the net fiscal impact from all prior years in a person’s life to see the net effect of their whole life up until that point on government finances at a given age. As can be seen in the graph on the next page, women in New Zealand (and presumably in other countries with similarly generous government benefits) never make a positive contribution to state finances.
The positive net fiscal impact women make from 45-59 never outweighs the prior negative net fiscal impacts. As a result, when the large negative net impacts of the retirement years arrive, they simply add to an already negative profile. Men, on the other hand, appear to have a positive cumulative net fiscal impact from approximately 40 until 80 years of age. For these particular taxes and public expenditures, the net fiscal incidence on men is approximately zero when cumulated over all ages.ii
Cumulative Net Fiscal Impact by Age and Gender

The above graph takes the 2010 cross-sectional data for net fiscal impact on government finances for each year and adds all previous years to get an estimate of cumulative lifetime impact at a particular age for both genders. As can be seen from this estimate, the brief period for which women have a net positive impact on government finances is not enough to offset their previous received benefits. Women are thus on average a net drain on government finances when considering their whole lifetime and do not contribute positively to government finances. Data from: Aziz, O., Gemmell, N., Laws, A. (2013) The Distribution of Income and Fiscal Incidence by Age and Gender: Some Evidence from New Zealand. University of Victoria Working Paper.

The United States generally has less socialized benefits compared to other countries and does not demonstrate as extreme of a trend, but the overall shape is similar. Though, as stated previously, the degree to which the same pattern is present in the US is somewhat obfuscated because some things which in other countries would be factored into state finances, such as healthcare, are not in the US. Obamacare is essentially a bachelor tax which would not get factored into the net fiscal impact since the “tax” goes through private insurance companies rather than through the government. Other essentially male-specific “taxes” that would not be generally included are things like child support and alimony that mostly go from men to their ex-wives, but passes through the state which skims off the top. Factoring in make-work government jobs overwhelmingly populated by women would also reduce the net fiscal impact of women since those taxes are merely a recirculation of other tax revenue.
Average Net Tax Payments by Age and Gender in the US (1991)
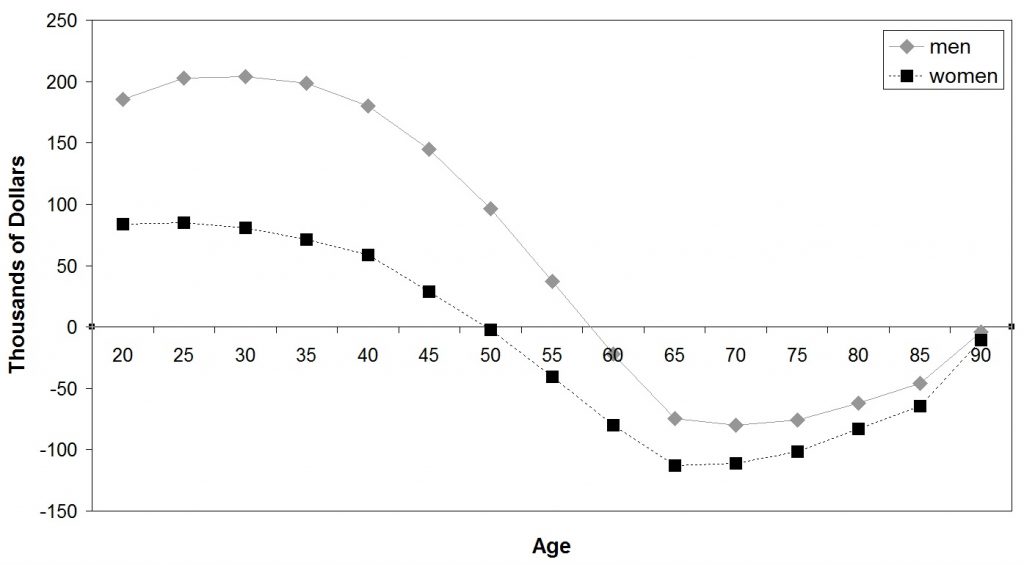
The above graph shows average tax payments minus transfers per person by age and gender in the US. As can be seen in the graph, men pay substantially more taxes during the entirety of their working life, and receive less net transfers in retirement. More recent IRS data does not group by both age and gender, but still shows that men overall pay substantially more in taxes than women. That men over all ages pay more suggests the pattern above is still present today. Data from: Aziz, O., Gemmell, N., Laws, A. (2013) The Distribution of Income and Fiscal Incidence by Age and Gender: Some Evidence from New Zealand. University of Victoria Working Paper. IRS data can be found here: Data on Salaries and Wages and Business Income, by Gender, Tax Year 2009. IRS Data. http://www.irs.gov/uac/SOI-Tax-Stats-Special-Studies-on-Individual-Tax-Return-Data#gend
Recent US data compiled by the international monetary fund shows that for most income measures men still are paying substantially more overt taxes across all age ranges than women and women are still receiving more in benefits (additional graphs can be found in that paper).x In other words, the general pattern discussed in great detail in the paper on the New Zealand population is broadly similar to the pattern which currently exists in the US and presumably all high tax, high benefit nations.
Virtually no quantitative indicators show that women as a population have any real capacity for being truly independent. They are heavily dependent on being subsidized by male taxpayers, husbands, and ex-husbands. The obvious conclusion that can be drawn from gender differences in taxation and benefits is that this data clearly demonstrates that modern “equality” is largely fraudulent. Women are no more independent now than they were when they were restricted to being housewives. The main difference between traditional societies and today is not that women are more independent, but that they are less directly dependent and more indirectly dependent on the productivity of men. They are, as a group, heavily reliant on state mediated wealth transfers from men.

In the past, men were only responsible for providing for their own wives and children. This constituted a fair and reciprocal symbiotic relationship between men and women. Men produced surplus to support their wives and children, and in return wives provided various household services and produced children for their husbands. Today, the once symbiotic relationship has morphed into a parasitic relationship where women depend on the coercive power of the government to extract wealth from men while providing little to men in return; both directly from fathers through child support and alimony that comes with easy divorce and indirectly through socialized healthcare, welfare, and retirement benefits. Maintaining this false, superficial equality requires an absolutely massive wealth transfer. The result is that working-age men have substantially less wealth to afford forming families of their own. This combines with the increasingly well-known costs of frivolous divorce to men to discourage marriage and disproportionately decreases the fertility of especially productive men relative to the less productive. Productive men have more that can be stolen so they take precautions to limit what can be taken by the state or potential future ex-wives. Given the genetic heritability of psychological traits, this drop in fertility guarantees that future generations will progressively have smaller and smaller proportions of productive men who can keep the current system solvent.
i Data on Salaries and Wages and Business Income, by Gender, Tax Year 2009. IRS Data. http://www.irs.gov/uac/SOI-Tax-Stats-Special-Studies-on-Individual-Tax-Return-Data#gend
ii Aziz, O., Gemmell, N., Laws, A. (2013) The Distribution of Income and Fiscal Incidence by Age and Gender:
Some Evidence from New Zealand. University of Victoria Working Paper.
iii (2012) Characteristics and Financial Circumstances of TANF Recipients, Fiscal Year 2010. US department of health and human services, Office of Family Assistance. http://www.acf.hhs.gov/programs/ofa/resource/character/fy2010/fy2010-chap10-ys-final
iv Morin, R. (2013) The politics and demographics of food stamp recipients. Pew Research.
http://www.pewresearch.org/fact-tank/2013/07/12/the-politics-and-demographics-of-food-stamp-recipients/
v Gellman, L. (1999) Female-Headed Households and the Welfare System. Poverty & Prejudice: Social Security at the Crossroads. Stanford University. ttps://web.stanford.edu/class/e297c/poverty_prejudice/soc_sec/hfemale.htm
vi Bradley, K., Rector, R. (2010) Confronting the Unsustainable Growth of Welfare Entitlements: Principles of Reform and the Next Steps. Heritage Foundation. Backgrounder #2427 on Welfare and Welfare Spending.
vii Lambro, D. (2013) LAMBRO: Obamacare will hurt young people most. Washington Times.
The Washington Times. http://www.washingtontimes.com/news/2013/feb/20/obamacare-will-hurt-young-people-most/#ixzz3RHVElidU
viii Bridges, B., Choudhury, S. (2009) Social Security as a Retirement Resource for Near-Retirees, by Race and Ethnicity, Nativity, Benefit Type, and Disability Status. Social Security Bulletin, Vol. 69 No. 1, 2009
ix A profile of older Americans: (2012). Administration on Aging Administration for Community Living. U.S. Department of Health and Human Services.
x Batini, N., Callegari, G., Guerreiro, J. (2011) “An Analysis of U.S. Fiscal and Generational Imbalances: Who Will Pay and How?” IMF Working Paper, Western Hemisphere Department. April 2011
One Reply to “How expensive are women?”